
Description
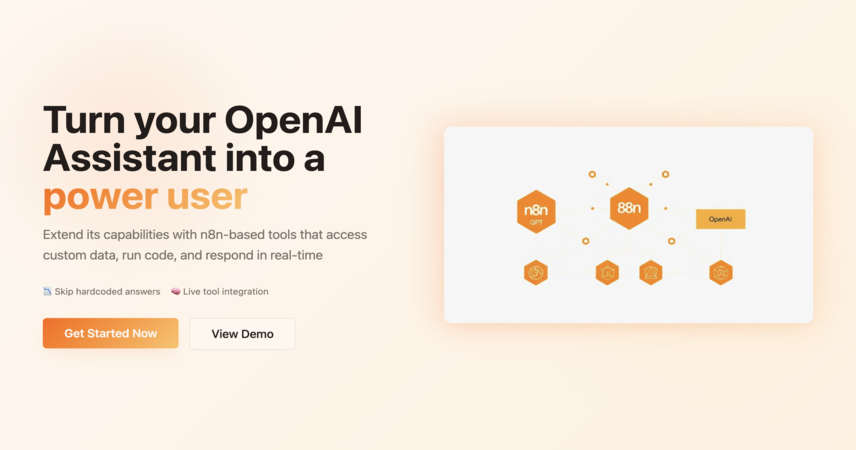
Ever wished your AI assistant could respond with visual data instead of just text? This intelligent workflow empowers your AI Agent to generate real-time charts — right inside a conversation — using OpenAI’s structured output and QuickChart.io.
Perfect for product stats, customer analytics, survey summaries, or anything that deserves a visual punch.
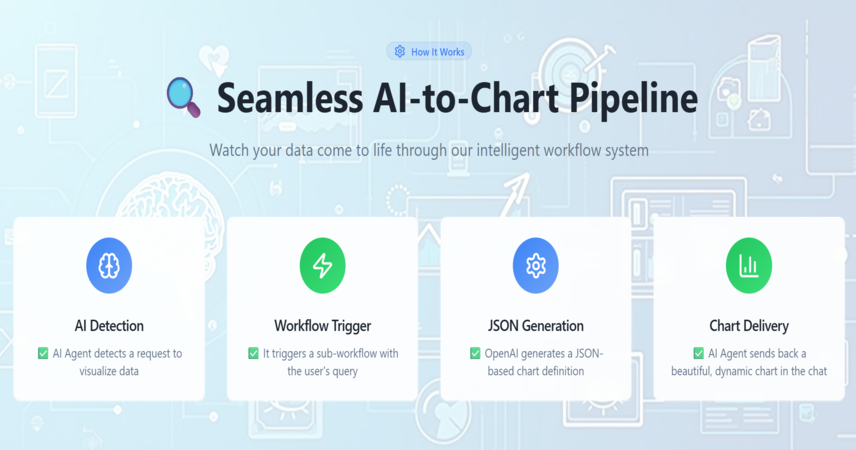
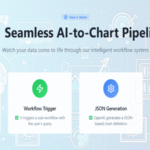
🔍 How It Works:
✅ AI Agent detects a request to visualize data ✅ It triggers a sub-workflow with the user’s query ✅ OpenAI generates a JSON-based chart definition ✅ The system builds a QuickChart image URL from that definition ✅ AI Agent sends back a beautiful, dynamic chart in the chat
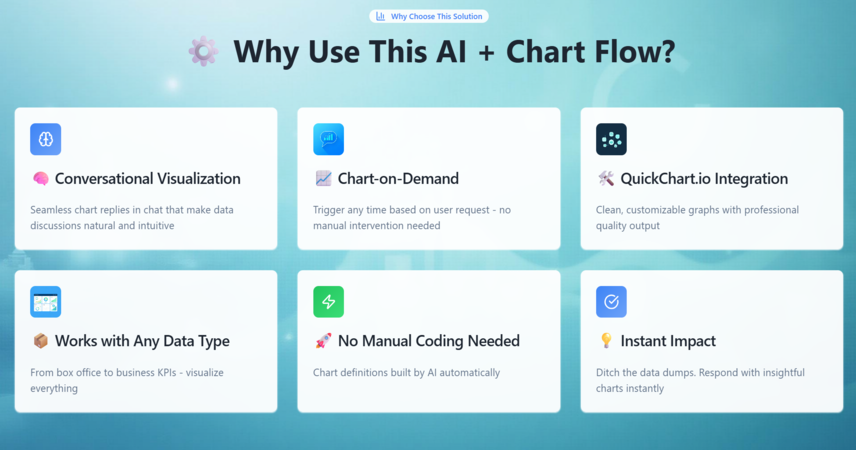
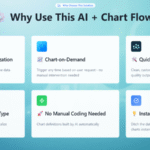
⚙️ Why Use This AI + Chart Flow?
🧠 Conversational Visualization – Seamless chart replies in chat 📈 Chart-on-Demand – Trigger any time based on user request 🛠️ QuickChart.io Integration – Clean, customizable graphs 📦 Works with Any Data Type – From box office to business KPIs 🚀 No Manual Coding Needed – Chart definitions built by AI
👥 Who’s It For?
✔️ AI App Builders & Chatbot Developers ✔️ Product Managers & Analysts ✔️ Dashboard-less Tool Creators ✔️ Data Teams running conversational insights ✔️ Devs exploring AI + data visualization
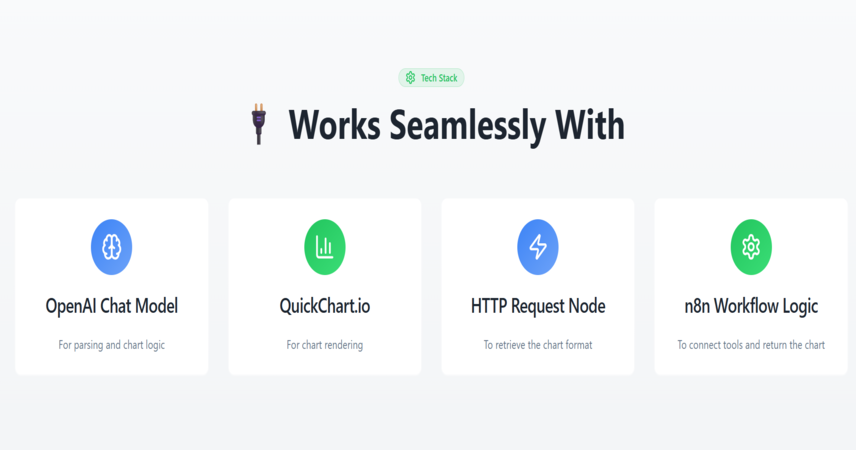
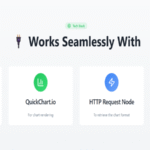
🔌 Works Seamlessly With:
- OpenAI Chat Model (For parsing and chart logic)
- QuickChart.io (For chart rendering)
- HTTP Request Node (To retrieve the chart format)
- n8n Workflow Logic (To connect tools and return the chart)
💡 Ditch the data dumps. Respond to queries with insightful charts — straight from your AI Agent.
📉 Data talks. Let your AI show it.
🚀 Build now. Impress users instantly.
Project Link - https://preview--conversive-charts.lovable.app/

 Visit Main Gignaati Website
 Learn with Gignaati Academy
 Explore Workbench
 Partner with Us
 Invisible Enterprises – Buy on Amazon
 Terms & Conditions
 Privacy Policy