
Description
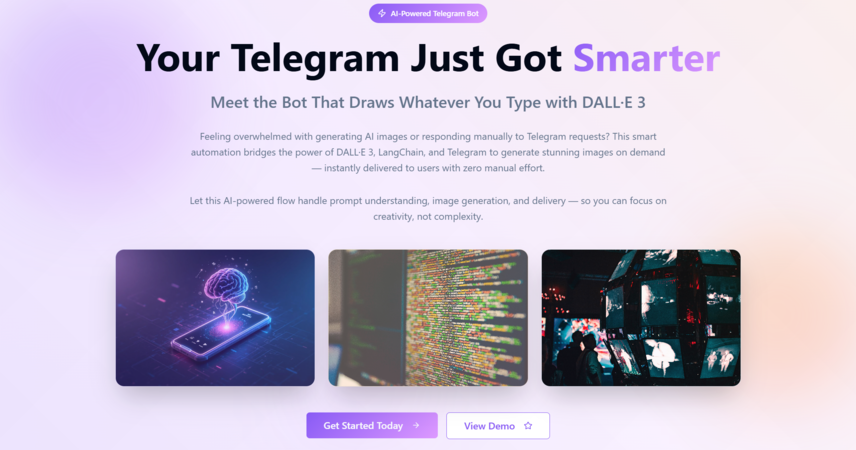
Combine the analytical power of a SQL Agent with AI-generated visualizations. This workflow allows your team to query databases in natural language and receive not just textual answers, but dynamic charts powered by OpenAI and Quickchart.io.
Ideal for analysts, product teams, and internal tools that need fast, understandable data insights.
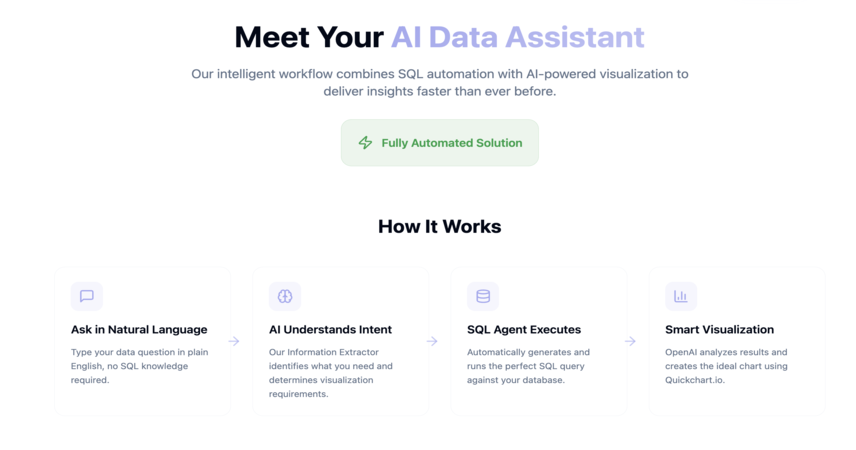
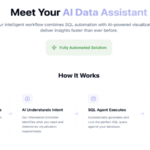
🧠 How It Works:
✅ 🧾 A user asks a question about data via a natural language input ✅ 🧠 The Information Extractor identifies the question's intent and checks if it includes a visual need ✅ 💾 The SQL Agent connects to the database and executes a relevant SQL query ✅ ✨ The Text Classifier analyzes the query and determines whether a chart would improve understanding ✅ 🧠 If a chart is needed, OpenAI is called to define the appropriate chart type and config ✅ 🧰 The chart definition is turned into a Quickchart.io URL using a simple Set node ✅ 📊 The final response includes both the SQL Agent's insight and the generated chart ✅ 🎯 If no visualization is needed, the plain SQL Agent answer is returned
🔍 It Automates:
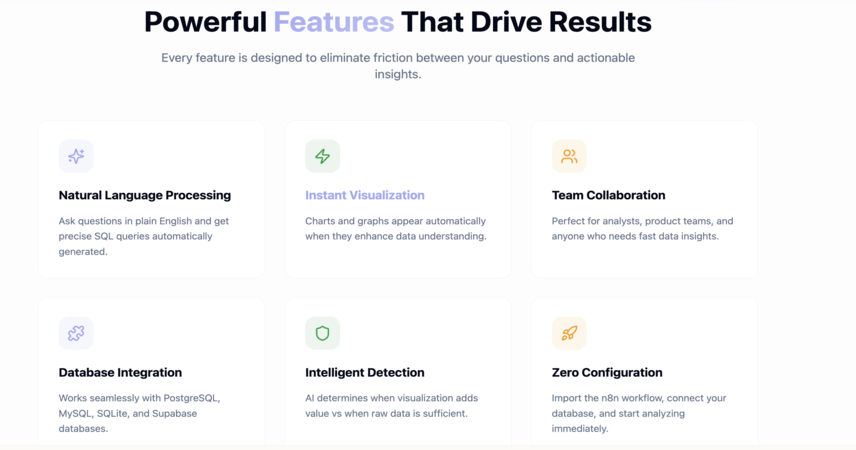
✅ Translating natural language into accurate SQL queries ✅ Intelligent detection of when to visualize data ✅ Dynamic chart creation based on query context ✅ Seamless delivery of insights as both text and image ✅ Integration of SQL Agent and visual feedback loop
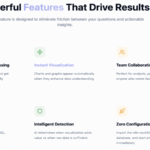
💡 Why Choose This Workflow:
✅ Turns raw query results into easily digestible visuals ✅ Enables non-technical users to extract insights with no SQL knowledge ✅ Great for dashboards, reports, or team data chats ✅ Fully automated—no chart configuration or manual generation required ✅ Extensible: supports PostgreSQL, MySQL, and SQLite
👤 Who Is This For:
✅ Data analysts & business intelligence teams ✅ Product and growth teams running ad-hoc queries ✅ Internal tool builders & low-code developers ✅ Teams using Supabase, PlanetScale, or local DBs ✅ Anyone wanting to bring clarity to data fast
🔗 Integrations:
✅ SQL Agent (native n8n agent for querying) ✅ OpenAI (for structured output and chart definitions) ✅ Quickchart.io (for on-the-fly chart rendering) ✅ Supabase, PostgreSQL, MySQL, or SQLite (for database access)
📊 Data Talks — Now It Paints the Picture Too Import this n8n workflow, connect your SQL database, and experience the power of AI-driven data analysis and visualization—hands-free.
Link : [https://lovable.dev/projects/f8a3cbd5-fa31-4bda-820c-1bf954b2210a]

 Visit Main Gignaati Website
 Learn with Gignaati Academy
 Explore Workbench
 Partner with Us
 Invisible Enterprises – Buy on Amazon
 Terms & Conditions
 Privacy Policy